みなさん、こんにちは、
みむすたーです。
本記事では、iStatsとmatplotlibを使用し、
Macの温度をグラフ化してみようと思いました。
iStatsの導入方法&使い方については、以前の記事にも載せてあるので、
こちらをご覧ください。
iStatsの導入方法&使い方
https://mimustar.com/2020/09/08/986/
iStatsを使うことで、Macのハードウェア上のセンサーから、
温度やファンの回転数、CPUのクロック数などのデータを確認することができます。
しかし、これはistatsというコマンドを実行した一回きりです。
そのため、一定時間内はiStatsコマンドを定期的に実行して欲しいなと考えました。
サンプルプログラム
import re
import subprocess as sp
import numpy as np
import matplotlib.pyplot as plt
import matplotlib.animation as animation
class QueuePlot:
cmd = ""
regexStr = ""
datalist = []
subplot = None
def __init__(self,cmd,regexStr,subplot):
self.setCommand(cmd)
self.setRegexStr(regexStr)
self.subplot = subplot
self.datalist = []
def setCommand(self, cmd):
self.cmd = cmd
def setRegexStr(self,regexStr):
self.regexStr = regexStr
def getCommandResult(self):
ret = sp.Popen(self.cmd.split(" "),stdout=sp.PIPE).communicate()[0]
# bytes -> string
ret = ret.decode("utf-8")
str = re.sub(self.regexStr,r'\1',ret)
return str
def cla(self):
if self.subplot == None:
return
ylim = self.subplot.set_ylim()
title = self.subplot.title.get_text()
self.subplot.cla()
self.subplot.set_ylim(ylim)
self.subplot.set_title(title)
def plot(self):
if self.subplot == None:
return
if len(self.datalist) > 100:
del self.datalist[0]
self.datalist.append(float(self.getCommandResult()))
self.subplot.plot(self.datalist)
# 無地のキャンバスを作成する
fig = plt.figure()
cpu_temp_plot = fig.add_subplot(2,2,1)
cpu_temp_plot.set_title("cpu_temp")
cpu_temp_plot.set_ylim(0,100)
fan_plot = fig.add_subplot(2,2,2)
fan_plot.set_title("fan")
fan_plot.set_ylim(0,10000)
battery_temp_plot = fig.add_subplot(2,2,3)
battery_temp_plot.set_title("battery_temp")
battery_temp_plot.set_ylim(0,100)
battery_capacity_plot = fig.add_subplot(2,2,4)
battery_capacity_plot.set_title("battery_capacity")
battery_capacity_plot.set_ylim(0,6000)
cpu_temp = QueuePlot('iStats cpu',r'CPU temp: +([0-9.]+).*', cpu_temp_plot)
fan = QueuePlot('iStats fan',r'.*\n.*Fan 0 speed: +([0-9]+).*\n.*', fan_plot)
battery_temp = QueuePlot('iStats battery temp',r'.*Battery temp: +([0-9.]+)..C.*', battery_temp_plot)
battery_capacity = QueuePlot('iStats battery capacity',r'.*Current charge: +([0-9]+).*\n.*\n.*', battery_capacity_plot)
def AnimationUpdater(frame):
cpu_temp.cla()
fan.cla()
battery_temp.cla()
battery_capacity.cla()
cpu_temp.plot()
fan.plot()
battery_temp.plot()
battery_capacity.plot()
# アニメーション作成
ani = animation.FuncAnimation(fig,AnimationUpdater, interval=2000)
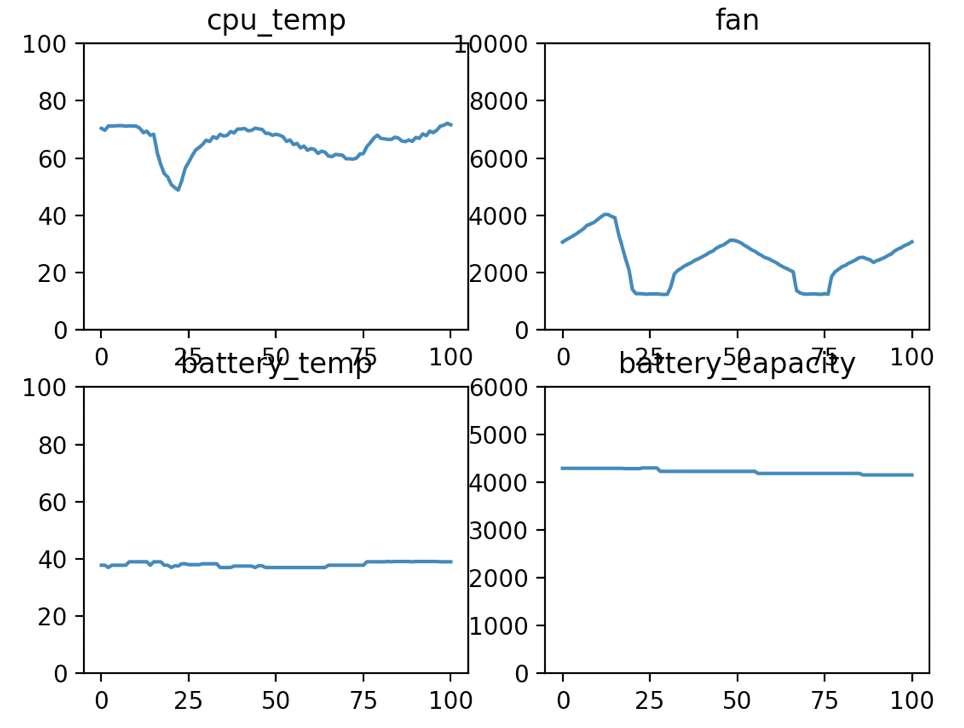
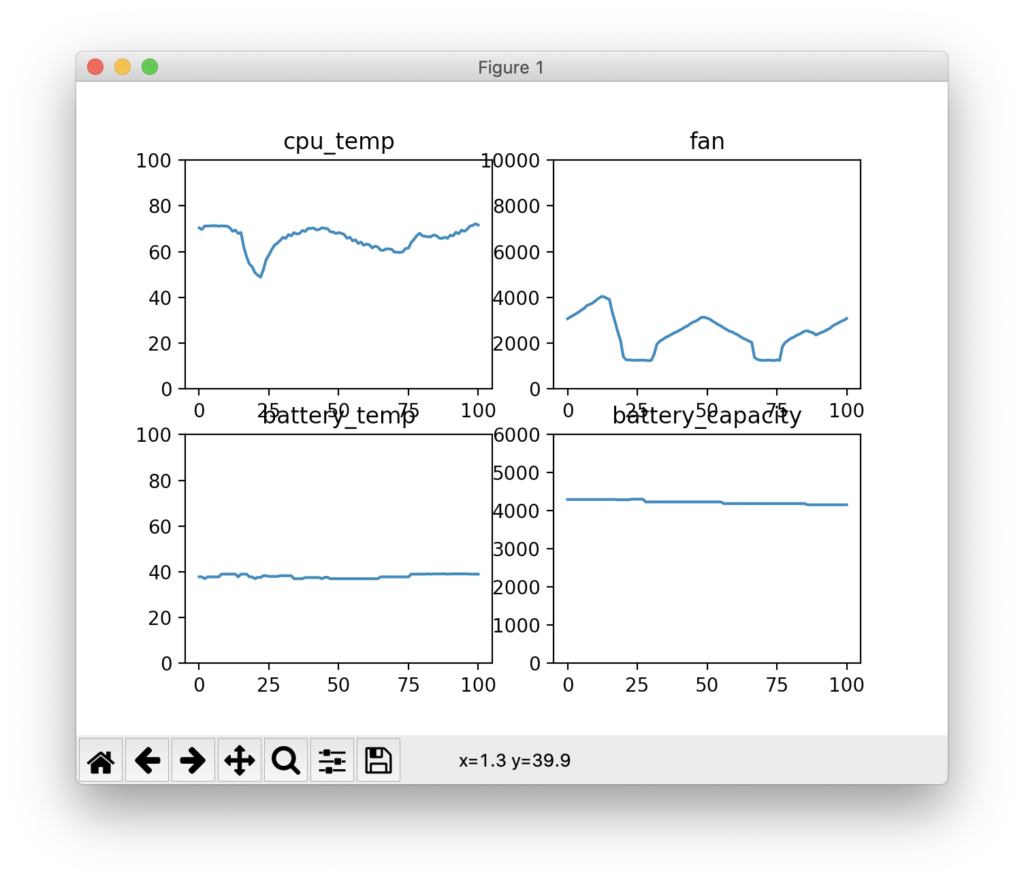
plt.show()上のソースコードがを実行したら、CPUの温度、ファンの回転数、バッテリーの温度、バッテリーの残量を折れ線グラフで表ます。
サンプルプログラムの動作

コメント