みなさん、こんにちは、
みむすたーです。
本記事では、

pythonでループするgif画像を作りたい!
という要望にお答えします。
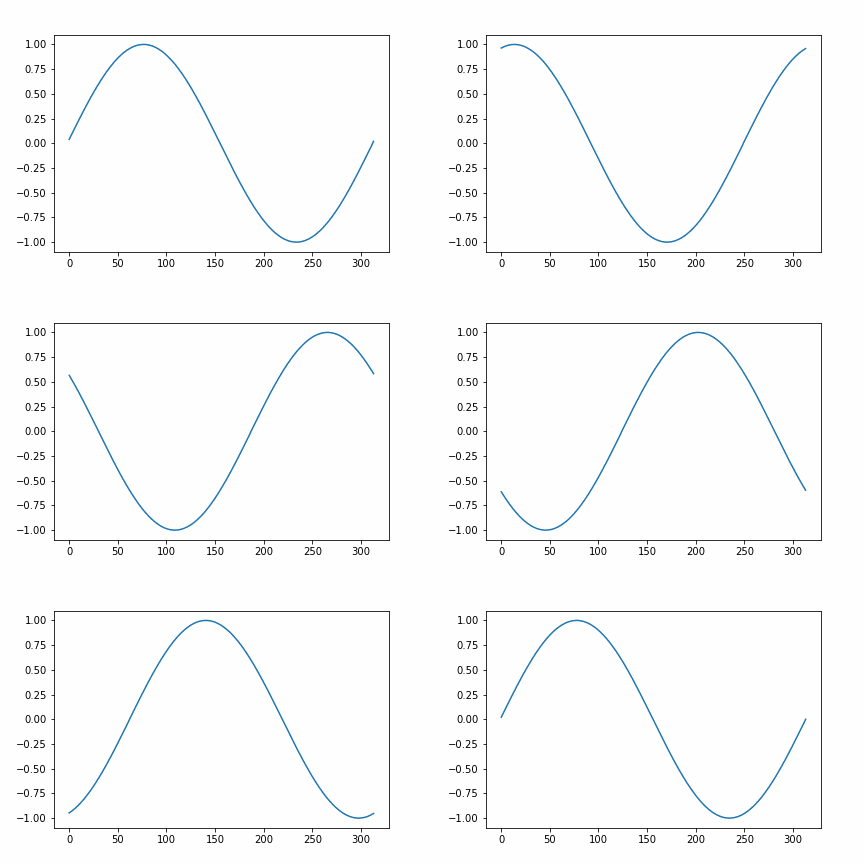
sin波のgif画像

上のサイン波を出力するプログラムは以下の通りです。
import numpy as np
import matplotlib.pyplot as plt
import matplotlib.patches as patches
import matplotlib.animation as animation

# 無地のキャンバスを作成する
fig = plt.figure()

# 描画領域を作成
ax = fig.add_subplot(1,1,1)

# xの配列を作成する
x = np.arange(0,3.14 * 2,0.02)

# yの配列を作成する
y = np.sin(x)

def AnimationUpdater(frame):
    global y
    # 表示されているグラフをリセット
    ax.cla()

    y = np.roll(y,-1)

    # yのグラフを表示
    ax.plot(y)

# アニメーション作成
ani = animation.FuncAnimation(fig,AnimationUpdater, interval=20,frames=np.size(y))
ani.save("sample.gif",writer="pillow")
sinθの波形の場合は、2πの周期で同じ形をとるので、
最初の波形と+2πした時の波形が同じなので、違和感のないgif画像が簡単に作成できます。
y = np.roll(y,-1)のところで、yのリストの先頭の要素をシフトしています。
第二引数の-1は1個分の左シフトを表しています。
このシフト処理によって、波打つようにsin波が流れていくような画像を出力することができます。


コメント